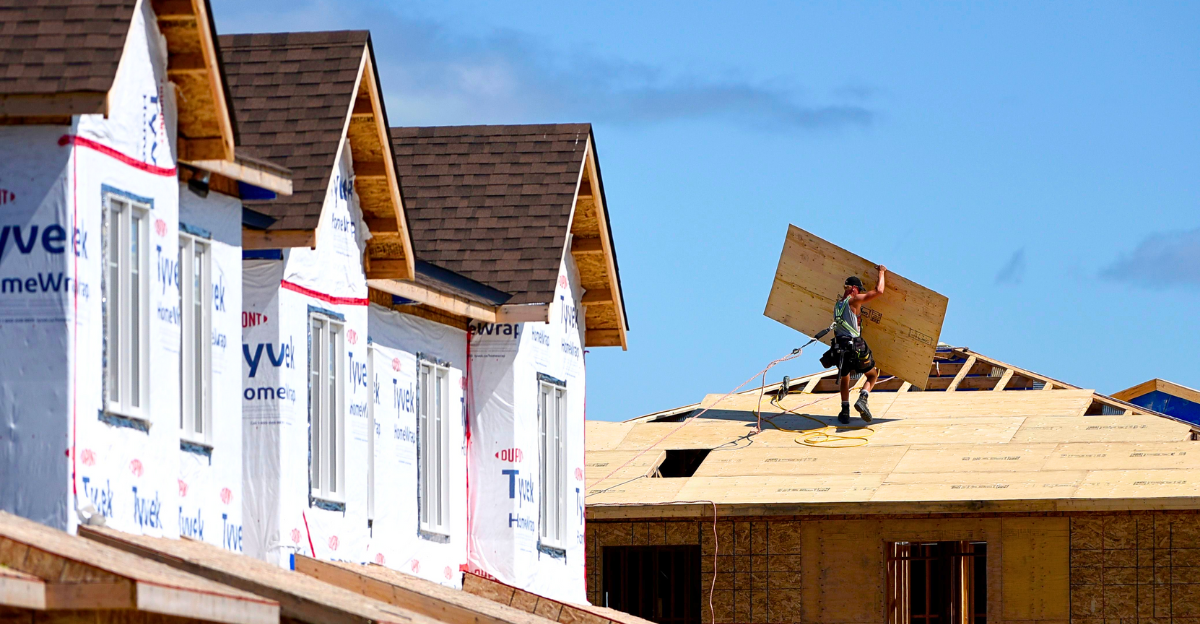
In 2025, the U.S. housing market has entered what is appropriately called a “Red Zone,” where warning signs of price drops or housing slumps are present in 44 of 50 major metropolitan areas. This pervasive cooling contrasts with prior years of unrelenting price increases propelled by low mortgage rates and demand during the pandemic. Economic uncertainty, high mortgage rates, and an increase in supply from pandemic building booms are all working together to drive down prices.
Once-rapidly appreciating suburbs and Sunbelt metro areas are now facing declining values, with double-digit percentage drops in places like Miami and Austin. Due to downward pricing pressure brought on by rising inventories and declining demand, this marks a significant transition from a seller-dominated market to one that is becoming more balanced or even preferred by buyers.
Historical Background and Past Cycles of the Housing Market

Due to their inherent cyclical nature, housing markets experience boom and bust periods roughly every ten years. Historical downturns like the Great Depression, the 2008 financial crisis, and other local downturns show how economic shocks, overbuilding, and speculative borrowing cause these corrections.
A sharp decline in home prices and worldwide financial instability were the results of the 2008 crash, which was brought on by subprime mortgage defaults. Particularly in hot markets and in cities where supply exceeded sustainable demand during COVID-19, current indicators reflect previous vulnerabilities. In contrast to prior financial product-driven crises, this slowdown is also driven by rising mortgage rates and erosion of affordability, raising concerns about a protracted downturn.
Factors Contributing to the Price Decline

The combination of several factors, including historically low affordability, persistently high mortgage rates (6.5–7%), and an increase in housing inventory as the backlog of pandemic-era construction is cleared, is primarily responsible for the price decline in America’s metro areas.
Demand has weakened as a result of many first-time and marginal buyers being priced out by high borrowing costs. In response to a less competitive market, sellers list more properties at the same time, increasing supply and giving buyers more negotiating power. Furthermore, in many areas, zoning laws and regulatory obstacles still limit the supply of affordable housing, resulting in ongoing disparities between demand groups and available housing.
Metro Hotspots and Regional Differences

The housing slide is most severe in the South and West metro areas, and even though it is now a nationwide phenomenon, Sunbelt cities like Austin, Miami, Phoenix, and Las Vegas are the hardest hit. During the pandemic, these markets saw explosive price increases, but they are currently witnessing steep drops. Over the past three years, prices in Austin have decreased by almost 15%, Miami has seen drops of nearly 19%, and Phoenix is seeing the beginnings of a significant price correction.
Similar trends can be seen in other areas, such as portions of Texas and California, where price declines are a reflection of oversupply and declining investor interest. Some metro areas in the Northeast and Midwest, on the other hand, are still more stable but are facing pressure as demand is being constrained by affordability across the country.
Mortgage Rates’ Impact on Purchase Behavior

The gatekeeper of housing affordability is mortgage rates. Their dramatic increase since the pandemic, which peaked in 2023 at about 8% before dipping slightly to about 6.5%, significantly raised monthly payments for average buyers. Because of this dynamic, buyers have less purchasing power and make more cautious choices.
Mortgage applications have decreased, home tours have slowed, and potential buyers are becoming more aggressive in their price and terms negotiations. Homes remain unsold longer when there are fewer qualified buyers, indicating the emergence of a buyer’s market. The moderating or sliding of prices across metros is significantly aided by this change in behavior.
Overregulation’s Contradictory Impact

The paradoxical impact of overregulation in both red and blue regions is one distinctive viewpoint. Even though the supply of affordable housing is increasing, zoning regulations, building costs, and permitting delays have limited the options available, despite the fact that they were initially designed to safeguard communities and control growth. These limitations exacerbate affordability crises by slowing down the glut’s absorption and keeping prices high in some places.
Additionally, they make the market brittle, making it susceptible to correction if demand wanes. The intricate political dynamics surrounding housing policy both facilitate and hinder recovery, adding complexity and duration to the crisis.
Is This Market Correction Healthy?

According to a contrarian perspective, this price decline might be a long-overdue correction that brings stability back to the market. Typical buyers were priced out and labor and living patterns were distorted as a result of the pandemic bubble’s unsustainable price inflation.
Even though it is painful, the current cooling may make things more accessible and less speculative, which could lessen the likelihood of a collapse similar to the one that occurred in 2008. According to some economists, this marks a turning point in the direction of a more balanced market. This viewpoint, however, depends on regulated price changes and preventing a severe crash, necessitating coordinated policy actions and stable economic conditions.
The Red Zone Matrix for Housing

Understanding the crisis through a “Red Zone Matrix” can help clarify the risk layers: regional regulatory rigidity versus economic diversification; affordability thresholds versus mortgage rate sensitivity; and supply glut versus demand contraction. Rapid price drops and construction halts are characteristics of cities that are locked in a high-risk quadrant.
This model compares recovery rates, helps identify which metro areas experience protracted downturns, and directs stakeholders to customize strategies rather than implementing general policies. These frameworks provide useful information that goes beyond simple statistics.
Anticipated Downstream Effects on Socioeconomics and Urban Migration

Declines in housing prices in once-hot Migration trends acquired during post-pandemic booms may be reversed in sunbelt metro areas. High costs and economic uncertainty could impede population growth or even cause reverse migration if affordability doesn’t improve.
Minority and lower-income groups are disproportionately affected by lower home values, which can exacerbate wealth inequality by reducing their gains and increasing their risk of displacement. As wealthy consumers take advantage of sales and vulnerable groups fight to maintain stable living conditions, economic polarization may worsen.
Possible Remedies and Policy Reactions

Multifaceted solutions are needed to address the Red Zone, including removing regulatory obstacles to speed up the delivery of affordable housing, providing targeted first-time buyer subsidies, encouraging the construction of diverse, sustainable buildings, and modifying monetary policy to control mortgage rates without shocking demand.
To protect against shocks, local governments must protect tax bases and promote economic diversity. Programs for community support and psychological counseling could lessen the negative effects on impacted homeowners’ mental health. Strategic responses can be strengthened by open communication about housing realities and transparent data tracking.
Unexpected Combinations of Industries and Creative Methods

Unconventional intersections could lead to innovations: financial tech companies creating mortgage products for unstable markets; real estate platforms incorporating AI for buyer matching and predictive pricing; urban planners and psychologists working together to create resilient, balanced communities; and partnerships with environmental scientists to guarantee long-term sustainability in changing metropolitan landscapes.
These strategies could reinterpret the housing market’s functionality and resilience in the face of ongoing uncertainty.
Clearly Addressing America’s Housing Red Zone

Nearly every major metro area in America is at a critical juncture where housing price declines are either a risk or a reality. This is known as the “Housing Red Zone.” A combination of economic, regulatory, demographic, and psychological factors has led to this uncommon, pervasive change.
Even though it can be difficult and painful, understanding these dynamics provides a way to take strategic, well-informed action to protect vulnerable groups, stabilize markets, and promote long-term resilience. This is a complicated systemic adjustment that calls for openness, creativity, and practical policies to direct America’s housing future; it is not just a cyclical downturn.