The stock market is soaring while everyday Americans struggle under rising debt, tariffs, and economic inequality. Mega-cap tech drives Wall Street gains, yet 130 million households face falling consumer confidence, layoffs, and rising costs. U.S. national debt now exceeds $38 trillion, fueling uncertainty. From tariffs to oil price drops, the K-shaped recovery reveals deep divides. Here’s what’s going on and why the disconnect between markets and Main Street is widening.
What’s Driving Wall Street Gains?

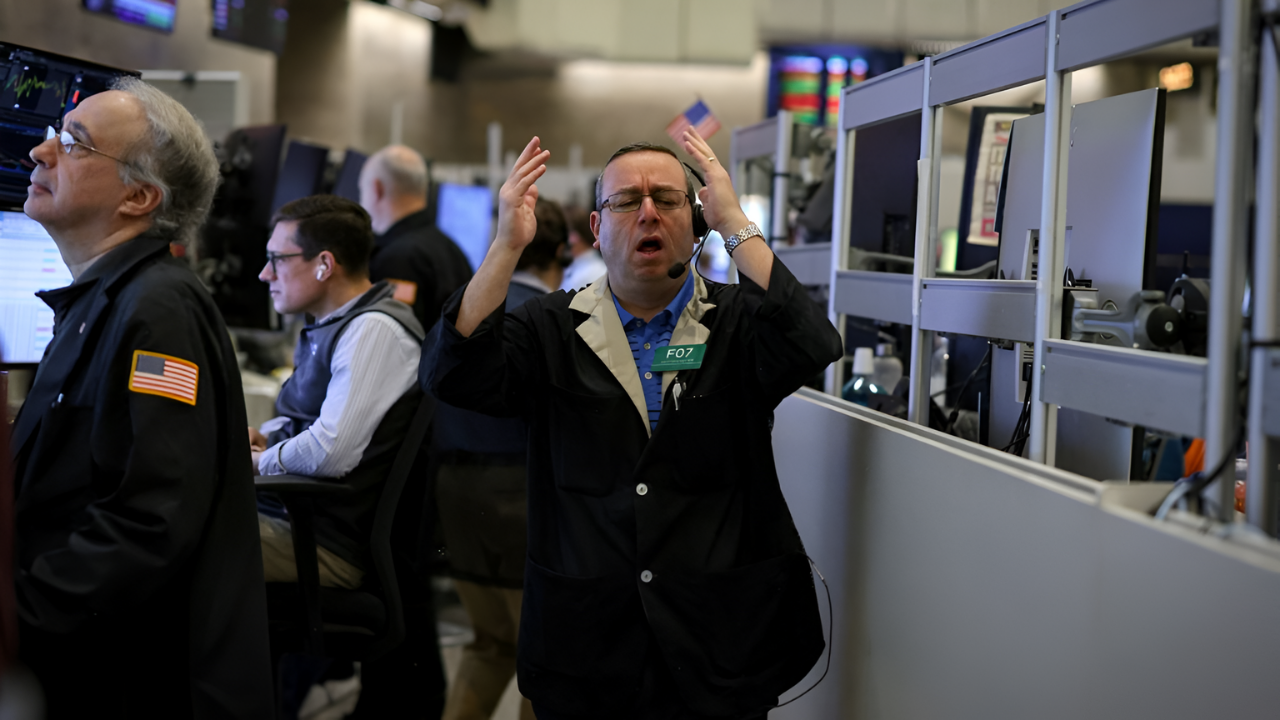
Wall Street’s rally in 2025 has been almost entirely fueled by mega-cap technology firms. Nvidia, Microsoft, Google, and Amazon make up 40% of the S&P 500’s value. Madison Investments reported that the top five firms alone contributed 2.5% to October returns. Yet, most other stocks lag, showing cracks beneath the surface.
The concentration of market gains highlights that headline numbers may be misleading. Investors see robust returns, but median S&P 500 stocks fell 1.7%, and the equal-weighted index dropped 0.9%. The apparent prosperity of Wall Street hides weakness in the broader market. Could this imbalance foreshadow a correction soon?
Main Street Faces Real Struggles

Average American households face declining consumer confidence, which dropped to 88.7 in November from 95.5 in October, the second-lowest level in five years. The University of Michigan sentiment index fell to 55.4 in September, indicating persistent anxiety. Rising prices, stagnant wages, and job uncertainty are driving caution across 130 million families nationwide.
These declines suggest that everyday Americans are absorbing economic shocks that Wall Street does not feel. Retail sales rose just 0.2% in September, reflecting restrained spending. Small businesses and households alike are confronting higher costs and tighter budgets, a reality increasingly disconnected from equity market optimism.
SMBs Struggle With Tariffs and Costs

Small and medium-sized businesses, responsible for 58% of U.S. jobs, face severe supply chain disruptions. Tariffs on Chinese imports average 30–50%, pressuring margins. Only 12% use advanced analytics to assess true cost implications. Many report tighter cash flow and inventory challenges, risking layoffs and lost competitiveness.
Manufacturers and e-commerce entrepreneurs are particularly vulnerable. Tariffs affect nearly all categories, from electronics to textiles. Even attempts to diversify sourcing to Vietnam, Bangladesh, or India offer partial relief. The uncertainty poses a threat to long-term investment, underscoring how policy choices have uneven ripple effects across sectors.
Rising Unemployment Pressures Workers

U.S. unemployment reached 4.4% in September, the highest since October 2021. This represents approximately 7.2 million people out of work, with 2.9 million more unemployed compared to a baseline of 3%. Sectors such as manufacturing, retail, automotive, textiles, and logistics are hardest hit, particularly younger workers in entry-level roles.
Rising layoffs contribute to consumer caution, further slowing spending. Even as the S&P 500 surges, Main Street remains stagnant and faces increasing financial stress. This widening gap fuels the K-shaped recovery, where upper-income households prosper while lower-income groups endure mounting hardships.
Income Disparity Drives K-Shaped Recovery

The K-shaped economy means wealthier Americans prosper while lower-income households struggle. In Q2 2025, the top 10% of earners accounted for 49% of consumer spending. Madison Investments noted that the dominance of mega-cap stocks enables strong market performance, despite most consumers facing inflation and stagnant wages.
This divergence deepens structural inequality. While Wall Street celebrates record gains, median households cut spending, face higher costs, and navigate job insecurity. Could this bifurcation accelerate social and economic tensions as 2026 approaches?
Retail Giants Adjust Prices

Companies like Walmart, Target, and Best Buy have raised prices due to tariffs. CEO Doug McMillon of Walmart noted in May that “higher tariffs will result in higher prices.” Target and Best Buy echo warnings of price increases affecting consumer purchasing power, particularly in tariff-heavy categories.
Consumers see goods becoming more expensive even without significant wage growth. Tariff-induced inflation strains household budgets while corporate profits rise. The disconnect between corporate earnings and real-life spending power underlines why Main Street feels left behind amid headline stock market gains.
Tech Sector Dominates the Market

Mega-cap tech companies drive nearly all S&P 500 gains. Nvidia, Microsoft, Google, Amazon, and Apple collectively account for 40% of the index’s value. Smaller tech firms and other sectors lag, highlighting concentration risks. Median stock performance shows that broader markets are not keeping pace with headline figures.
This dominance risks creating fragility. A sudden market shock or regulatory changes affecting these firms could ripple through portfolios and retirement funds. Wall Street’s optimism remains highly dependent on a handful of companies, leaving little buffer for systemic challenges.
Automotive and Apparel Hit Hard

Tariffs impact auto and apparel sectors heavily. Car import tariffs reach 25%, adding $4,000–$12,000 to vehicle costs. Textiles face rates up to 145%, raising clothing prices roughly 17%. Retailers adjust sourcing strategies, but costs and delays persist, squeezing margins and raising consumer prices.
Higher costs not only reduce household spending power but also force small businesses to rethink operations. This ongoing burden contributes to broader stagnation and highlights the uneven effects of trade policies across industries.
Energy Sector Faces Revenue Decline

US oil exporters, previously global leaders, face a 25% revenue decline as crude prices fall from ~$80 to under $60 per barrel. This translates to roughly $29 billion annually in lost revenue. Energy producers confront margin compression, reduced capital expenditure, and potential layoffs.
Lower revenues intensify the K-shaped crisis. While tech investors gain, workers in energy and related industries face job losses and wage stagnation. The revenue shock emphasizes that different sectors are experiencing dramatically different realities.
Federal Reserve Navigates Challenges
Federal Reserve Chair Jerome Powell stated in October that additional rate cuts were “not a foregone conclusion—far from it.” The Fed’s caution reflects concerns about inflation, debt servicing constraints, and a complex economic environment complicated by tariffs and market volatility.
Policy uncertainty affects consumer borrowing, business investment, and market sentiment. As the Fed balances growth and inflation, households and small businesses remain vulnerable to higher costs, highlighting how macroeconomic tools can lead to uneven outcomes.
Debt Levels Create Fiscal Pressure

The U.S. national debt exceeded $38 trillion in October. Annual debt servicing costs reached $726 billion, consuming 14% of the federal budget. This limits federal flexibility for stimulus or infrastructure spending, increasing vulnerability to economic shocks and slowing recovery for Main Street.
High debt levels compound the effects of tariffs, energy price shocks, and unemployment. As fiscal space shrinks, economic resilience depends increasingly on private investment, which is concentrated in a few sectors, reinforcing the K-shaped pattern.
Timeline of Crises Unfolds

The crisis began with tariffs in April , followed by stagnating retail sales and rising unemployment in September. A 43-day government shutdown in October and November delayed economic data. By late November, consumer confidence collapsed to 88.7, while oil prices dropped under $60 per barrel, signaling deepening systemic stress.
The sequence illustrates how compounding pressures affect households and businesses unevenly. Understanding these steps clarifies how policy, markets, and macroeconomics interact, creating a widening divide between Wall Street and Main Street.
Consumer Confidence Collapses

Consumer confidence fell from 95.5 in October to 88.7 in November 2025, reflecting growing pessimism. Even small rebates, like the proposed $2,000 per year, cover only a fraction of tariff-related costs, leaving many households feeling financially insecure.
Confidence and spending reductions feed back into the economy. Retail stagnation, rising unemployment, and rising prices reinforce the perception of decline, highlighting the K-shaped divergence between investors and ordinary households.
Mechanisms of the K-Shap

Tariffs and rising costs ripple through the economy in a cascading series of effects: corporate cost absorption, supply chain disruptions, consumer spending contraction, retail stagnation, rising unemployment, higher wholesale prices, and energy revenue losses. Each step magnifies the pressure on Main Street while wealthier households benefit from asset appreciation.
The K-shaped recovery is not just abstract theory. It explains why markets can thrive while the majority of Americans struggle. The mechanisms illustrate how structural inequalities intersect with policy and market forces to yield starkly different outcomes.
Recession Risks Into 2026
Economic slowdown risks mount if AI data center investment falters. Harvard economist Jason Furman warned: “Without [AI data centers], US output would have barely grown this year, but if the stock market dives, much of that capital will disappear very quickly.” A downturn could deepen K-shaped disparities.
The coming months will test whether Wall Street gains remain insulated from the pressures of Main Street. Capital concentration, debt burden, tariffs, and energy shocks all interact to create a fragile economic environment that could unfold dramatically in 2026.
Sources
U.S. Census Bureau, Retail Sales Data September 2025
The Conference Board, Consumer Confidence Index November 2025
U.S. Bureau of Labor Statistics, Employment Report September 2025
Yale Budget Lab, State of U.S. Tariffs October 17, 2025
Harvard Business School, Tariff Pass-Through Research November 2025
Al Jazeera Economy Desk, “US National Debt Surpasses $38 Trillion” October 23, 2025
Federal Reserve Economic Data (FRED), Debt Servicing Costs 2023–2025
U.S. Tariff Commission / U.S. Trade Representative, Tariff Schedules April–December 2025